 Catalogo de metadatos del IGME
LITHOSPHERE (soil, geological processes)
Type of resources
Available actions
Topics
Provided by
Years
Formats
Representation types
Update frequencies
status
Service types
Scale
-
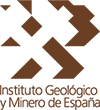
Map showing the chronolithostratigraphic units of the Region of Murcia grouped by the different structural domains present in the region, accompanied by the tectonic structure expressed by faults and traces of folding structures. On the Neogene and Quaternary units, the different facies present in each of them have been differentiated, reflecting the sedimentation domain and system, the geomorphological unit and the lithology.
-
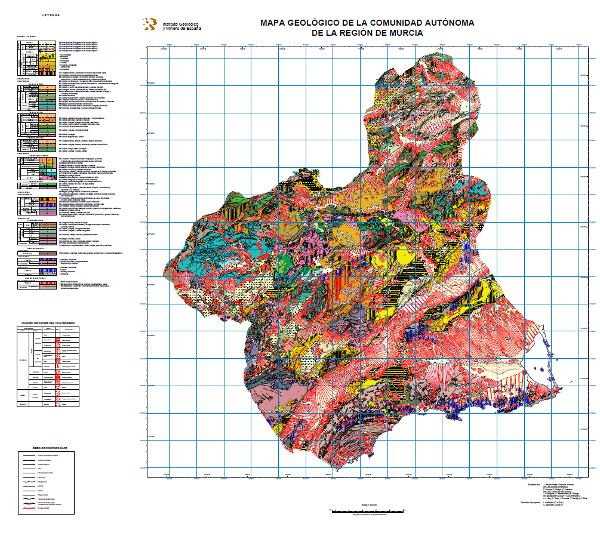
Map with the chronolithostratigraphic units of the Valencian Community accompanied by faults and folding structures. It is a unified geological synthesis based on IGME maps of this territory at 1:200.000 and 1:50.000 scale.
-
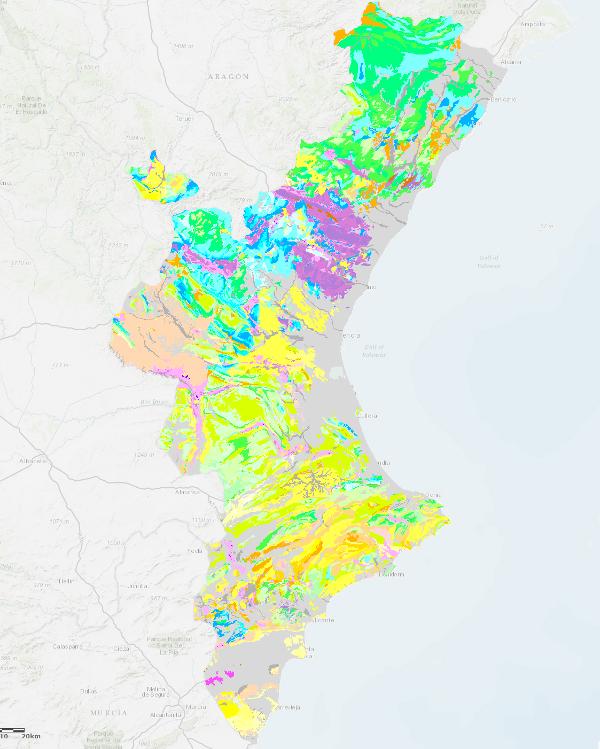
The Lithological Map of the Iberian Peninsula, Balearic and Canary Islands at a scale of 1:1,000,000 is a map produced by the Geological Survey of Spain (IGME) based on the Geological Map of the Iberian Peninsula, Balearic and Canary Islands published in 1995. The cartographic units represented in it have been established using lithological criteria, with the lithological association defining the limits of each unit. The geological information on the Iberian Peninsula and the Balearic Islands is in UTM projection, zone 30, Postdam datum. The information for the Canary Islands is in UTM projection, zone 28, datum Pico de las Nieves. The map is distributed free of charge in shape format through the IGME website.
-
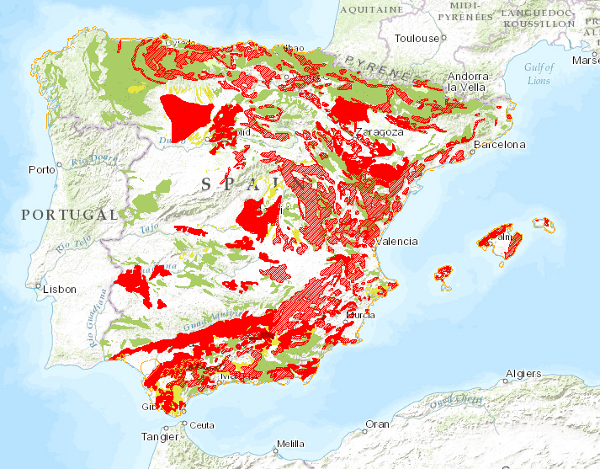
Map delimiting the areas with different types of land movements, representing the most intense and frequent movements. It therefore shows the distribution and extent of the most problematic areas from a practical point of view. Land movements are classified into four main groups: horizontal component movements (landslides and landslides), vertical component movements (subsidence and subsidence, and expansive clays), unstable processes in coastal areas and movements related to mining operations. Areas with significant erosion processes are also included. This map, published in 1987, was drawn up entirely by staff of the Geological Survey of Spain in response to the need for information on geological hazards and risks on a national scale.
-
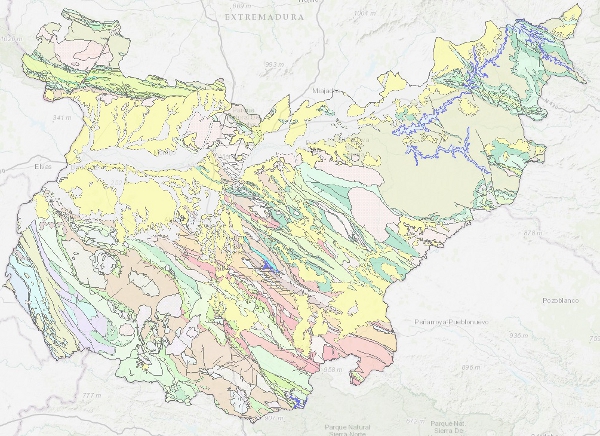
Map with the chronolithostratigraphic and igneous units of the province of Cáceres grouped together as a support for the mapping of mineral resources in the province. The contacts between the different cartographic units have been classified as "stratigraphic contact" and "intrusive contact". The tectonic structure is expressed by faults.
-
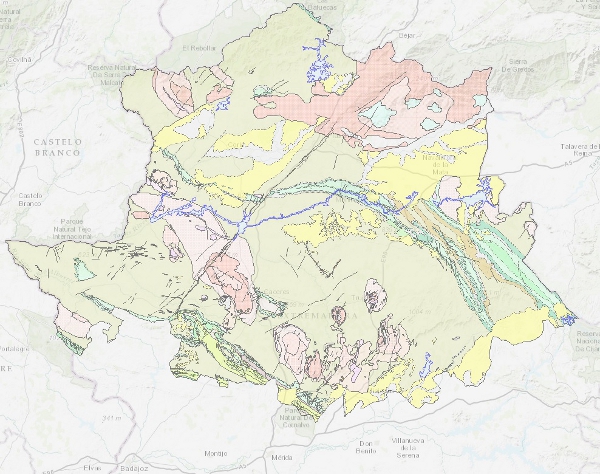
Map with the chronolithostratigraphic and igneous units of the province of Badajoz grouped together as a support for the mapping of mineral resources in the province. The contacts between the different cartographic units have been classified as "stratigraphic contact" and "intrusive contact". The tectonic structure is expressed by faults.
-
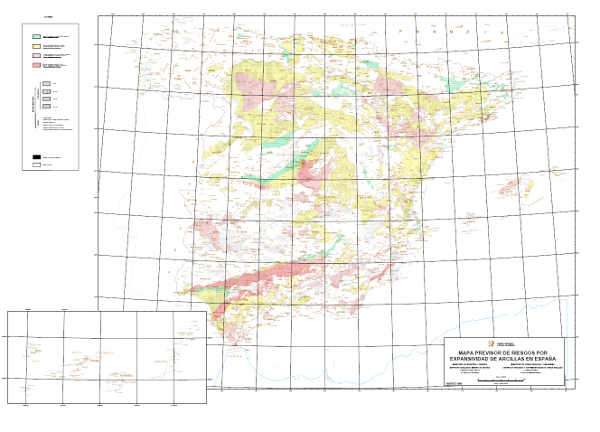
El Mapa Previsor de Riesgos por Expansividad de Arcillas de España a escala 1:1.000.000 delimita las formaciones arcillosas , clasificándolas en 4 grados según su potencial de expansividad: Arcillas no expansivas o dispersas en matriz no arcillosa: Riesgo de expansividad nulo o bajo; Arcillas expansivas subordinadas o emplazadas en zonas climáticas sin déficit anual de humedad: Riesgo de expansividad bajo a moderado; Arcillas expansivas localmente predominantes emplazadas en zonas climáticas con déficit anual de humedad: Riesgo de expansividad moderado a alto; Arcillas expansivas predominantes en zonas donde se han presentado problemas de expansividad. Riesgo de expansividad alto a muy alto. El término expansividad define la capacidad del suelo para experimentar cambios de volumen al modificarse sus condiciones de humedad, o para generar presiones si se impide la expansión del mismo. Este mapa ha sido realizado por el Instituto Geológico y Minero de España (IGME) con la colaboración del Centro de Estudios y Experimentación de Obras Públicas/CEDEX) en el año 1986.
-
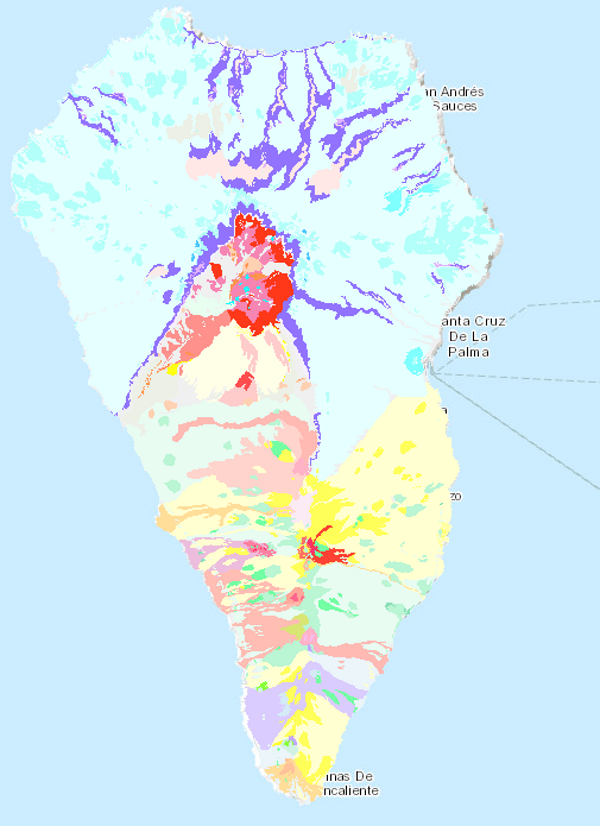
The map of the island of La Palma includes volcanic and sedimentary units separated by different types of contacts: undifferentiated between formations, between lava flows of the same formation and intrusive. The different units have been grouped into different categories according to their genesis, structure and arrangement, such as eruptions, edifices or volcanoes. The direction of the flow lava flows is shown by means of the corresponding symbology. Tectonic processes are shown as faults and recent local features as active slumps. Additional information includes mineral deposits and indications, archaeological sites and other volcanic elements of specific representation. The map is accompanied by the chronolithostratigraphic legend and conventional signs.
-
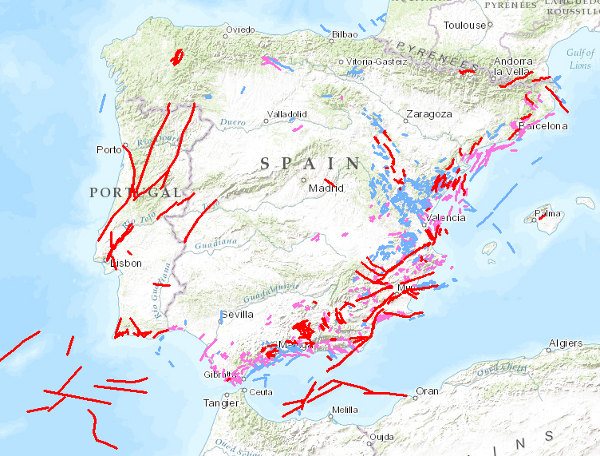
Visualisation service of QAFI, a database of faults with geological evidence of proven activity during the Quaternary period (the last 2.6 million years according to the limit officially established by the SQS in 2009) of the Iberian Peninsula. It is a project in constant revision and updating as a result of the progress of studies and knowledge about the structures capable of generating earthquakes in Iberia, and can never be considered complete or definitive, both because of the scientific nature of the data contained in it, and because of the modus operandi used in its construction: the altruistic collaboration of numerous researchers in Earth Sciences.
-
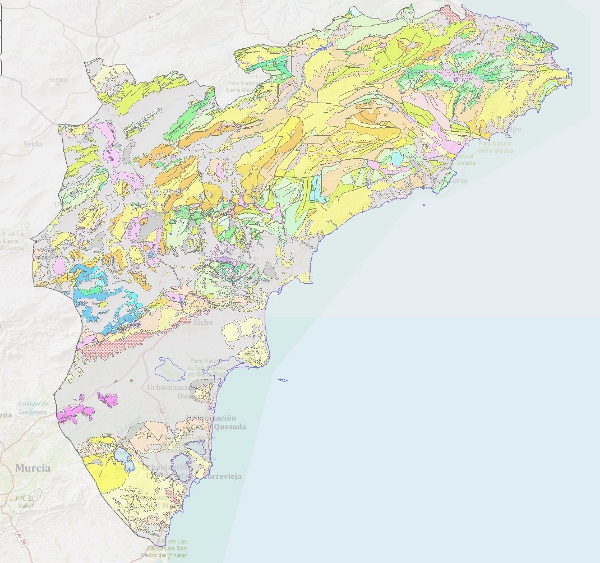
Map showing the geological units classified according to chronostratigraphic and lithological criteria from the point of view of mineral resources. Each cartographic unit has an associated description and geological age. The geological and tectonic structure is represented by faults, thrusting and folding structures. This map, which covers the entire province of Alicante, has been drawn up by the Geological Survey of Spain as part of the "Basic Master Plan for the Natural Mineral Resources of the Valencian Community", the result of the Singularised Collaboration Agreement between the Department of Industry and Trade of the Valencian Regional Government and the IGME in the field of research and management of the natural mineral resources of the Valencian Community. The agreement was signed in 2000, and work began that same year. The geological mapping of the province of Alicante was completed in 2002. It was carried out using the existing geological cartography of the Geological Map of Spain at a scale of 1:50,000, MAGNA, and the available geological cartography at a scale of 1:200,000. The information is in coverage format (ESRI) and consists of a file with the cartographic units, contacts and faults, a file with the folding structures, a file with the lithostratigraphic legend and a file with the conventional geological symbols. The geological description, the geological age and the representation codes of the geological units can be found in three tables.